一、程序CPU过高问题
Go程序像C/C++一样,如果开发编码考虑不当,会出现cpu负载过高的性能问题。如果程序是线上环境或者特定场景下出现负载过高,问题不好复现,则需要利用当前负载过高的进程进行调用栈分析。
C/C++中一般先通过top -d 1 -p $pid -H 命令查看负载过高的线程号(TID),然后使用gdb attach pid到该进程,通过thread info获取线程信息,然后切换到对应负载高的线程,输入bt查看调用栈。结合对应代码中的函数,进一步分析。
Go语言中方法也类似,通过 dlv 来分析负载高的协程调用栈。
二、CPU过高问题排查过程
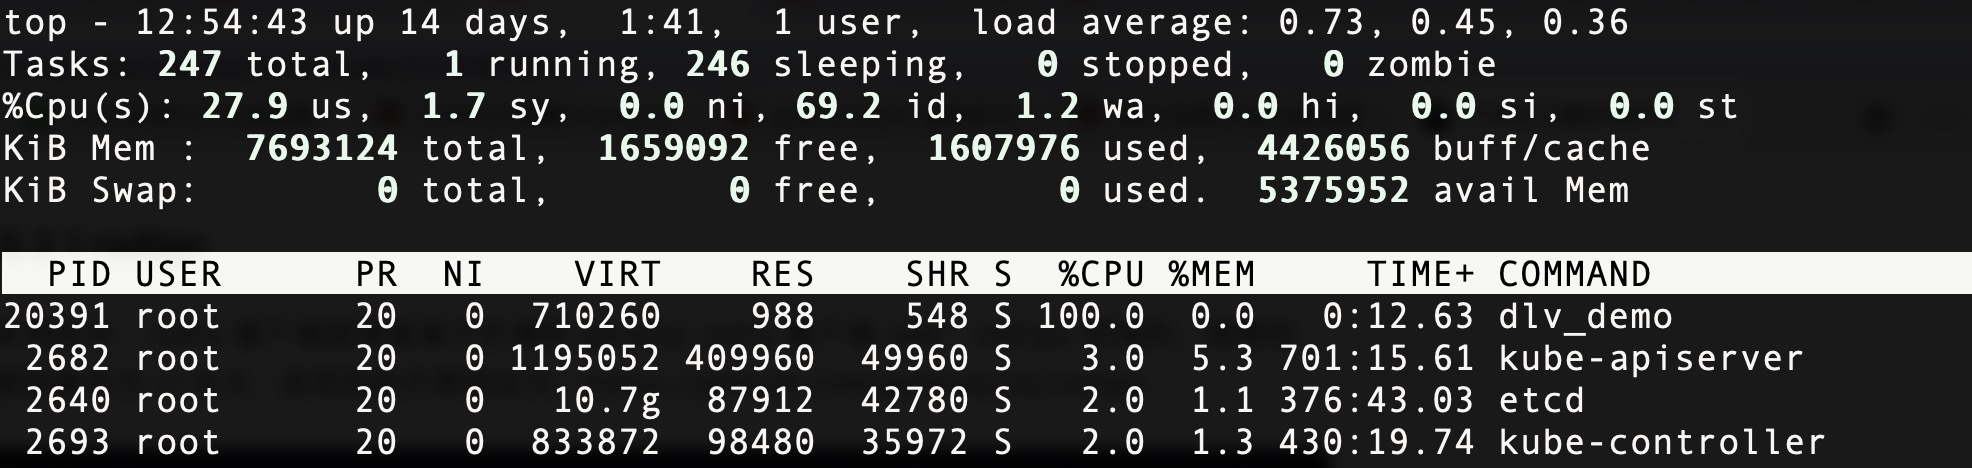
2.1 通过top查看高cpu的进程pid
通过top -d 1命令,可以发现cpu过高的进程进程 pid,如下图所示:
2.2 通过top查看高cpu的线程tid
通过上一步,确定cpu使用率过高的进程pid,然后就可以以通过top -d 1 -p pid -H来确认cpu过载的线程tid,如下图所示:
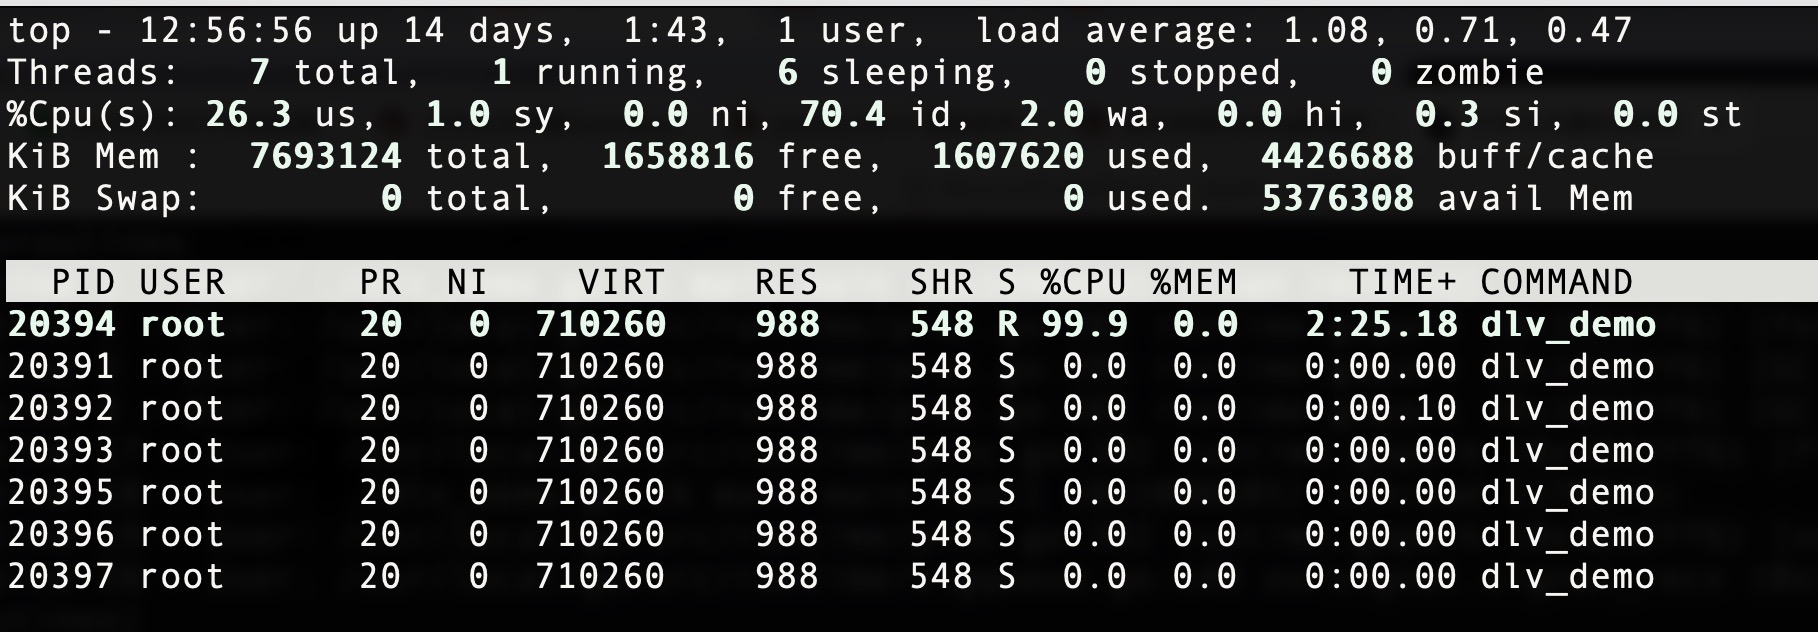 通过以上操作,可以确认导致cpu过高的tid(线程 或 goroute)。
2.3 通过dlv attach 到进程,分析线程/协程cpu过载的堆栈
Tips: 如果生产环境没有dlv,则可以拷贝对应的dlv到/usr/local/bin下。
通过 dlv attach pid 命令 attach 到CPU过高的进程中,列出进程的 goroutines 序号
 1
 2
 3
 4
 5
 6
 7
 8
 9
10
11
12
13
|
192:~ mastaer1$ dlv attach 20391
Type 'help' for list of commands.
(dlv) goroutines
  Goroutine 1 - User: ./dlv_demo.go:25 main.main (0x1090ddd) [chan receive]
  Goroutine 2 - User: /usr/local/go/src/runtime/proc.go:382 runtime.gopark (0x1032ff6) [force gc (idle)]
  Goroutine 3 - User: /usr/local/go/src/runtime/proc.go:382 runtime.gopark (0x1032ff6) [GC sweep wait]
  Goroutine 4 - User: /usr/local/go/src/runtime/proc.go:382 runtime.gopark (0x1032ff6) [GC scavenge wait]
  Goroutine 5 - User: /usr/local/go/src/runtime/proc.go:382 runtime.gopark (0x1032ff6) [finalizer wait]
  Goroutine 6 - User: ./dlv_demo.go:16 main.main.func1 (0x1090e85) (thread 20394)
  Goroutine 7 - User: /usr/local/go/src/runtime/proc.go:382 runtime.gopark (0x1032ff6) [select]
  Goroutine 17 - User: /usr/local/go/src/runtime/sigqueue.go:149 os/signal.signal_recv (0x105c968)
[8 goroutines]
(dlv)
|
2.3 在dlv中切换到对应高cpu协程,并查看堆栈
 1
 2
 3
 4
 5
 6
 7
 8
 9
10
11
12
13
14
15
16
17
18
19
20
21
22
23
24
|
192:~ mastaer1$ dlv attach 20391
Type 'help' for list of commands.
(dlv) goroutines
  Goroutine 1 - User: ./dlv_demo.go:25 main.main (0x1090ddd) [chan receive]
  Goroutine 2 - User: /usr/local/go/src/runtime/proc.go:382 runtime.gopark (0x1032ff6) [force gc (idle)]
  Goroutine 3 - User: /usr/local/go/src/runtime/proc.go:382 runtime.gopark (0x1032ff6) [GC sweep wait]
  Goroutine 4 - User: /usr/local/go/src/runtime/proc.go:382 runtime.gopark (0x1032ff6) [GC scavenge wait]
  Goroutine 5 - User: /usr/local/go/src/runtime/proc.go:382 runtime.gopark (0x1032ff6) [finalizer wait]
  Goroutine 6 - User: ./dlv_demo.go:16 main.main.func1 (0x1090e85) (thread 20394)
  Goroutine 7 - User: /usr/local/go/src/runtime/proc.go:382 runtime.gopark (0x1032ff6) [select]
  Goroutine 17 - User: /usr/local/go/src/runtime/sigqueue.go:149 os/signal.signal_recv (0x105c968)
[8 goroutines]
(dlv) goroutine 6
Switched from 0 to 6 (thread 2905239)
(dlv) bt
0  0x00000000010051b6 in runtime.chanrecv
   at /usr/local/go/src/runtime/chan.go:457
1  0x0000000001005b85 in runtime.selectnbrecv
   at /usr/local/go/src/runtime/chan.go:714
2  0x0000000001090e85 in main.main.func1
   at ./dlv_demo.go:16
3  0x0000000001060061 in runtime.goexit
   at /usr/local/go/src/runtime/asm_amd64.s:1598
(dlv)
|
通过以上操作,可以确认业务底层的栈帧是第2帧,dlv_demo.go:16行的main.func1函数相关,查看对应版本代码找出导致CPU高的原因。
本示例中的代码:
 1
 2
 3
 4
 5
 6
 7
 8
 9
10
11
12
13
14
15
16
17
18
19
20
21
22
23
24
25
26
27
28
29
|
// dlv_demo.go
package main

import (
	"fmt"
	"os"
	"os/signal"
)

func main() {
	fmt.Println("main start")

	msgList := make(chan int, 100)
	go func() {
		for {
			select {
			case <-msgList:
			default:

			}
		}
	}()

	c := make(chan os.Signal, 1)
	signal.Notify(c, os.Interrupt, os.Kill)
	s := <-c

	fmt.Println("main exit.get signal:", s)
}
|
从上面的堆栈信息,可以定位到main.go 16行,再分析对应的代码,就可以确定是select中加了defualt但没有任何处理导致cpu空转,从而导致cpu过高。