一、Go程序性能分析简介
1.1 Go程序性能分析简介
Go程序的性能分析主要分析是程序运行时的 CPU使用率、Memory申请回收、IO操作、Goroutine资源竞争、死锁等情况。
对 Go程序的性能分析 可在程序编译、测试 及 线上运行 等各阶段进行,在不同的阶段可通过使用不同的性能分析工具(有的是Golang 提供的、有的是操作系统自带的、还有也可以使用第三方的命令工具或库)对程序的各类性能指标进行不同程度的分析了解,以期找到程序的性能问题加以解决或规避。
二、Go程序编译阶段性能分析
2.1 Go 的竞态检测机制 (race)
由于 Golang 中创建 goroutine 是非常方便的,goroutine函数内又非常容易隐藏有新的 goroutine创建。很多时候,我们调用的第三方库或包函数可能也会创建新的 goroutine。
goroutine 的广泛使用增加了程序的并行度、直接增加了程序运行时的竞态问题。比如一个全局变量,如果没有加上锁,在一个比较庞大的项目下,就根本不知道这个变量是不是会引起多个 goroutine 竞争。
官网的文章 Introducing the Go Race Detector 给出的例子就说明了这点::
 1
 2
 3
 4
 5
 6
 7
 8
 9
10
11
12
13
14
15
16
17
18
19
20
21
|
package main

import(
    "time"
    "fmt"
    "math/rand"
)

func main() {
    start := time.Now()
    var t *time.Timer
    t = time.AfterFunc(randomDuration(), func() {
        fmt.Println(time.Now().Sub(start))
        t.Reset(randomDuration())
    })
    time.Sleep(5 * time.Second)
}

func randomDuration() time.Duration {
    return time.Duration(rand.Int63n(1e9))
}
|
这个例子看起来没任何问题,但是实际上 time.AfterFunc 函数内是会另外启动一个 goroutine 来进行计时和执行参数传递进入的 func(),由于 func 中有对 t(Timer) 进行操作 t.Reset, 而主 goroutine 也有对 t 进行操作 t=time.AfterFunc,这个时候,其实有可能会造成两个 goroutine 对同一个变量进行竞争的情况。
运行示例将检查出计时器存在的竞态问题:
 1
 2
 3
 4
 5
 6
 7
 8
 9
10
11
12
13
14
15
16
17
18
19
20
21
22
23
24
25
26
27
28
29
30
|
192:~ mac$ go run -race timerRace.go
44.075211ms
==================
WARNING: DATA RACE
Read at 0x00c000120020 by goroutine 7:
  main.main.func1()
      /Users/timerRace.go:14 +0xd3

Previous write at 0x00c000120020 by main goroutine:
  main.main()
      /Users/timerRace.go:12 +0x164

Goroutine 7 (running) created at:
  time.goFunc()
      /usr/local/go/src/time/sleep.go:176 +0x47
==================
577.3503ms
997.66344ms
1.896443147s
2.009932667s
2.333443549s
2.71960772s
3.231947064s
4.032072468s
4.055836179s
4.13913674s
4.227799394s
4.324800254s
Found 1 data race(s)
exit status 66
|
在 Golang 中提供了**竞态检测工具 (race detector)**来对程序中存在的 竞态 问题进行检查,这个竞态检测工具是在编译流程中内置到程序的代码中的,一旦程序开始运行,它能够发现和报告程序中任何它所检测到的竞态情况。
Golang 通过 race 机制对程序竞态检测命令使用格式:
1
|
go build/run/test/install -race sourcecode.go
|
注意,race 会限制 goroutine 的数量到8192,并且在分析的过程中会增加额外的 CPU 开销,因此建议只在测试环境中使用。
开启 race 并运行服务之后,如果服务有多个协程同时使用同一个变量,就会打印竞态 WARNING: DATA RACE 提示信息:
 1
 2
 3
 4
 5
 6
 7
 8
 9
10
11
12
13
14
15
|
package main

func main () {
    var i int

    go func () {
        for i < 100 {
            i--
        }
    } ()

    for i < 100 {
        i ++
    }
}
|
编译运行:
 1
 2
 3
 4
 5
 6
 7
 8
 9
10
11
12
13
14
15
16
17
|
192:SourceCodeTest mac$ go build -race race.go
192:SourceCodeTest mac$ ./race
==================
WARNING: DATA RACE
Read at 0x00c00001c0d8 by goroutine 5:
  main.main.func1()
      /Users/mac/MubeiSpaces/NoteOnLearning/SourceCodeTest/racel.go:7 +0x5e

Previous write at 0x00c00001c0d8 by main goroutine:
  main.main()
      /Users/mac/MubeiSpaces/NoteOnLearning/SourceCodeTest/racel.go:13 +0xc7

Goroutine 5 (running) created at:
  main.main()
      /Users/mac/MubeiSpaces/NoteOnLearning/SourceCodeTest/racel.go:6 +0xae
==================
Found 1 data race(s)
|
这个命令输出的 WARNING: DATA RACE 提示 (在第6 行创建的) goroutine5 运行到第 7 行 和 main goroutine 运行到 13 行的时候触发了 write - read 竞争。
根据分析这个提示就可以看到这个程序在哪个地方存在 竞态 问题了。
-race 参数会引发 CPU 和内存的使用增加,所以基本是在测试环境使用,不是在正式环境开启。
上述代码加锁解决并发竞态问题后,将通过 race 检查。
2.2 go 语言常见并发(竞态)问题及解决方式
1、常见的并发(竞态)问题
- 并发访问 map:Golang 中 map 是非并发安全的类型,sync.Map 是并发安全的。
- 循环变量被捕获
1
2
3
4
5
|
for _ , job := range jobs {
    go func() {
       ProcessJob(job)
    }()
}
|
 1
 2
 3
 4
 5
 6
 7
 8
 9
10
11
12
13
14
15
16
17
18
|
x , err := Foo ()
if err != nil {
    ...
}

go func () {
    var y int
    y , err = Bar ()
    if err != nil {
        ...
    }
}()

var z string
z , err = Baz ()
if err != nil {
    ...
}
|
 1
 2
 3
 4
 5
 6
 7
 8
 9
10
11
12
13
14
15
16
|
func NamedReturnCallee () ( result int) {
    result = 10
    if ... {
        return // this has the effect of " return 10"
    }

    go func () {
        ... = result // read result
    }()

    return 20 // this is equivalent to result =20
}

func Caller () {
    retVal := NamedReturnCallee ()
}
|
 1
 2
 3
 4
 5
 6
 7
 8
 9
10
11
12
13
|
func Redeem ( request Entity ) ( resp Response , err error ) {
    defer func () {
        resp , err = c.Foo (request , err)
    }()

    err = CheckRequest ( request )
    ... // err check but no return
    go func () {
        ProcessRequest (request, err != nil)
    }()

    return // the defer function runs after here
}
|
- 传值和传引用的问题: 比如 go 的并发库中的 mutex 等不允许被 copy, 所以传递时需要使用指针的方式。
所有避免产生竟态背后的核心原则是防止对同一变量或内存位置同时进行读写访问。
2、避免竟态的方式
- sync.WaitGroup 等待:解决数据竟态的最直接方法是阻止其它goroutine读/写访问直到goroutine完成读/写操作为止,这时可以使用:
 1
 2
 3
 4
 5
 6
 7
 8
 9
10
11
12
13
14
15
|
func getNumber() int {
	var i int
	// 初始化一个 WaitGroup 变量
	var wg sync.WaitGroup
	// Add(1) 表示有一个任务需要等待, 等待任务数增加一个
	wg.Add(1)
	go func() {
		i = 5
		// 调用 wg.Done 表示完成一个处于等待队列中的任务, 出入等待中的任务减少一个
		wg.Done()
	}()
	// 调用 wg.Wait 阻塞等待, 直到 wg.Done 与通过 wg.Add 添加到任务队列中的的任务数一样, 也即一直等到等待队列中的任务数减为 0
	wg.Wait()
	return i
}
|
- 用 channel 阻塞等待:该方法在原理上与最后一种方法类似:
 1
 2
 3
 4
 5
 6
 7
 8
 9
10
11
12
13
|
func getNumber() int {
	var i int
	// 创建一个类型为空结构体的 channel, 并初始化为空结构体
	done := make(chan struct{})
	go func() {
		i = 5
		// 一旦完成前面修改 i 值的工作, 就推送一个空结构体到 done 中
		done <- struct{}{}
	}()
	// 该方式使程序处于阻塞状态, 直到从 channel 类型变量 done 中获取到推送的值
	<-done
	return i
}
|
- 返回 channel 通道
下面的方式是代替上面的第 (2) 种使用通道来阻塞函数的方式, 我们可以返回一个 channel, 一旦获得结果, 就可以通过该通道推送结果。与前两种方法不同, 此方法本身不会进行任何阻塞。相反, 它保留了阻塞调用代码的时机。
 1
 2
 3
 4
 5
 6
 7
 8
 9
10
11
|
// 返回一个 int 型的 channel 来代替返回 int
func getNumberChan() <-chan int {
	// 创建一个 int 型 channel
	c := make(chan int)
	go func() {
		// 推送一个 int 值到 channel
		c <- 5
	}()
	// 立即返回 channel 变量
	return c
}
|
之后, 在需要使用的时候可以从调用代码中的通道获取结果:
1
2
3
4
5
|
func main() {
	// 代码被阻塞直到从被推入的返回 channel 中取出值, 与前面的方法相反, 在 main 函数中阻塞, 而不是函数本身
	i := <-getNumberChan()
	fmt.Println(i)
}
|
这种方法更加灵活, 因为 它允许更高级别的功能决定自己的阻塞和并发机制, 而不是将 getNumber 功能视为同步功能。
- 使用互斥锁
上面 3 种方式解决的是 i 在写操作完成后才能读取的情况。现在有以下情况: 不管读写顺序如何, 只要求它们不能同时发生。针对这种场景, 应该考虑使用互斥锁:
 1
 2
 3
 4
 5
 6
 7
 8
 9
10
11
12
13
14
15
16
17
18
19
20
21
22
23
24
25
26
27
28
29
30
31
32
33
34
|
// 首先, 创建一个结构体, 其中包含我们想要返回的值以及一个互斥实例
type SafeNumber struct {
	val int
	m   sync.Mutex
}

func (i *SafeNumber) Get() int {
	// The `Lock` method of the mutex blocks if it is already locked
	// if not, then it blocks other calls until the `Unlock` method is called
	// Lock 方法
	// 调用结构体对象的 Lock 方法将会锁定该对象中的变量; 如果没有, 将会阻塞其他调用, 直到该互斥对象的 Unlock 方法被调用
	i.m.Lock()
	// 直到该方法返回, 该实例对象才会被解锁
	defer i.m.Unlock()
	// 返回安全类型的实例对象中的值
	return i.val
}

func (i *SafeNumber) Set(val int) {
	// 类似于上面的 getNumber 方法, 锁定 I 对象直到写入"i.val"的值完成
	i.m.Lock()
	defer i.m.Unlock()
	i.val = val
}

func getNumber() int {
	// 创建一个`SafeNumber`的示例
	i := &SafeNumber{}
	// 使用"Set"和"Get"来代替常规的复制修改和读取值, 这样就可以确保只有在写操作完成时我们才能进行阅读, 反之亦然
	go func() {
		i.Set(5)
	}()
	return i.Get()
}
|
然后, GetNumber 可以像其他情况一样使用。乍一看, 这种方法似乎毫无用处, 因为我们仍然无法保证其值 i。
当有多个写入与读取操作混合在一起, 使用 Mutex 互斥可以保证读写的值与预期结果一致。
2.3 go vet 程序静态分析
go vet 工具是 go代码静态诊断器,可以用以检查 go项目中可通过编译但仍可能存在错误的代码,例如无法访问的代码、错误的锁使用、不必要的赋值、布尔运算错误等。
命令语法:
1
|
go vet [-C dir] [-n] [-x] [-vettool prog] [build flags] [vet flags] [packages]
|
例如当前目录定义了main.go文件,在fmt.Printf()中使用了错误的格式符%d,而编译器并不会检查到该错误,这会导致程序运行时的输出和预期不符。
1
2
3
4
5
6
7
8
|
package main

import "fmt"

func main() {
    s := "this is a string"
    fmt.Printf("inappropriate formate %d\n", s)
}
|
使用vet命令进行静态检查,会报告此错误:
1
2
3
|
$ go vet main.go
# command-line-arguments
./main.go:7:2: Printf format %d has arg s of wrong type string
|
vet的代码分析是由多个子诊断器组成的,这些诊断器单元代表着vet的检测范围:
 1
 2
 3
 4
 5
 6
 7
 8
 9
10
11
12
13
14
15
16
17
18
19
20
21
22
23
|
To list the available checks, run "go tool vet help":

    asmdecl      report mismatches between assembly files and Go declarations
    assign       check for useless assignments
    atomic       check for common mistakes using the sync/atomic package
    bools        check for common mistakes involving boolean operators
    buildtag     check that +build tags are well-formed and correctly located
    cgocall      detect some violations of the cgo pointer passing rules
    composites   check for unkeyed composite literals
    copylocks    check for locks erroneously passed by value
    httpresponse check for mistakes using HTTP responses
    loopclosure  check references to loop variables from within nested functions
    lostcancel   check cancel func returned by context.WithCancel is called
    nilfunc      check for useless comparisons between functions and nil
    printf       check consistency of Printf format strings and arguments
    shift        check for shifts that equal or exceed the width of the integer
    stdmethods   check signature of methods of well-known interfaces
    structtag    check that struct field tags conform to reflect.StructTag.Get
    tests        check for common mistaken usages of tests and examples
    unmarshal    report passing non-pointer or non-interface values to unmarshal
    unreachable  check for unreachable code
    unsafeptr    check for invalid conversions of uintptr to unsafe.Pointer
    unusedresult check for unused results of calls to some functions
|
例如上文示例中的格式化符的错误,就是检查子诊断器printf中报出的错误。
更多细节,可通过命令go tool vet help 查看,例如:
1
|
go tool vet help printf
|
使用vet时,其默认是打开了所有的诊断器。如果想禁用某个诊断器analyzer,则可以加上-=false,代表不检查analyzer包含的内容。
1
|
go vet -printf=false main.go
|
相应的,如果只想使用某个特定的analyzer,那么可加上-=true,代表只检查analyzer所包含的内容。
1
|
go vet -printf=true main.go
|
vet命令除了可以设置诊断器之外,还提供了很多flag,这里就不详细列出。可通过go tool vet help命令查看完整内容。
这里介绍两个相对有用的flag
-c=N:设置此flag可以输出错误代码行的上下相邻N行源代码。
1
2
3
4
5
6
7
8
|
$ go vet -c=2 main.go
# command-line-arguments
./main.go:7:2: Printf format %d has arg s of wrong type string
       func main() {
               s := "this is a string"
               fmt.Printf("inappropriate formate %d\n", s)
       }
|
-json:设置此flag可以将错误报告以json形式输出。
 1
 2
 3
 4
 5
 6
 7
 8
 9
10
11
12
|
 $ go vet -json main.go
# command-line-arguments
{
    "command-line-arguments": {
        "printf": [
            {
                "posn": "/Users/slp/go/src/example/vet/main.go:7:2",
                "message": "Printf format %d has arg s of wrong type string"
            }
        ]
    }
}
|
通过查看vet的源码(位于$GOROOT/src/cmd/vet/main.go),可以发现其诊断器全是通过引入库golang.org/x/tools/go/analysis中的内容,这是Go官方所维护的库。详细代码可以在github地址:https://github.com/golang/tools/tree/master/go/analysis中获取。
常见错误示例与vet诊断:
 1
 2
 3
 4
 5
 6
 7
 8
 9
10
11
12
13
14
15
16
17
18
|
package main

import "fmt"

func main() {
    i := 1

    fmt.Println(i != 0 || i != 1)
    fmt.Println(i == 1 && i == 0)
    fmt.Println(i == 1 && i == 1)
}

// 运行检测
$ go vet main.go
# command-line-arguments
./main.go:8:14: suspect or: i != 0 || i != 1
./main.go:9:14: suspect and: i == 1 && i == 0
./main.go:10:14: redundant and: i == 1 && i == 1
|
 1
 2
 3
 4
 5
 6
 7
 8
 9
10
11
12
13
14
15
16
17
18
19
20
21
|
package main

import (
    "fmt"
    "time"
)

func main() {
    arr := []int{1,2,3}
    for _, i := range arr{
        go func() {
            fmt.Println(i)
        }()
    }
    time.Sleep(time.Second)
}

// 运行检测
$ go vet main.go
# command-line-arguments
./main.go:12:16: loop variable i captured by func literal
|
 1
 2
 3
 4
 5
 6
 7
 8
 9
10
11
12
13
14
15
16
17
18
19
20
21
22
23
24
|
package main

import (
    "fmt"
    "sync"
)

func valueMutex(msg string, mutex sync.Mutex)  {
    mutex.Lock()
    defer mutex.Unlock()
    fmt.Println(msg)
}

func main() {
    mu := sync.Mutex{}
    msg := "this is a message"
    valueMutex(msg, mu)
}

// 运行检测
$ go vet main.go
# command-line-arguments
./main.go:8:35: valueMutex passes lock by value: sync.Mutex
./main.go:17:18: call of valueMutex copies lock value: sync.Mutex
|
这种用法是非常危险的,函数参数中不能值传递锁(锁不能被复制),应该使用指针(将参数类型sync.Mutex改为*sync.Mutex),否则极容易导致死锁。
 1
 2
 3
 4
 5
 6
 7
 8
 9
10
11
12
13
14
15
16
17
18
19
|
package main

import "fmt"

func unreachable(str string) string {
    return str
    // something work
    return "result"
}

func main() {
    s := unreachable("init string")
    fmt.Println(s)
}

// 运行检测
$ go vet main.go
# command-line-arguments
./main.go:8:2: unreachable code
|
 1
 2
 3
 4
 5
 6
 7
 8
 9
10
11
12
13
14
15
16
17
18
19
20
|
package main

import (
    "context"
    "time"
)

func child(ctx context.Context) {
    // do something
}

func main() {
    ctx, _ := context.WithTimeout(context.Background(), time.Second*5)
    child(ctx)
}

// 运行检测
$ go vet main.go
# command-line-arguments
./main.go:15:7: the cancel function returned by context.WithTimeout should be called, not discarded, to avoid a context leak
|
2.4 解析汇编代码
go tool objdump -S [方法名] 可执行文件
三、Go程序测试阶段性能分析
3.1 Go程序性能分析工具 pprof 简介
pprof 是 Go 官方提供的性能分析工具,可以分析程序的运行情况,并且提供可视化的功能。prof 是 profile(画像)的缩写,使用 pprof 可以分析程序的以下几种指标数据:
- allocs:程序启动之后内存分配的情况
- block:导致阻塞操作的一些堆栈跟踪信息
- cmdline:当前程序启动的命令行
- goroutine:所有当前 goroutine 的堆栈跟踪信息
- heap:程序在当前堆上内存分配的情况
- mutex:锁资源的竞争的堆栈信息
- profile:CPU profile文件。可以在 debug/pprof?seconds=x秒 GET 参数中指定持续时间。获取pprof文件后,使用 go tool pprof x.prof命令分析pprof文件。
- threadcreate:系统线程的使用情况
- trace:当前系统的代码执行的链路情况
使用 pprof 工具主要分析以下几种指标:
- CPU Profiling:CPU 分析,按照一定的频率采集所监听的应用程序 CPU(含寄存器)的使用情况,可确定应用程序在主动消耗 CPU 周期时花费时间的位置;
- Memory Profiling:内存分析,在应用程序进行堆分配时记录堆栈跟踪,用于监视当前和历史内存使用情况,以及检查内存泄漏;
- Block Profiling:阻塞分析,记录 goroutine 阻塞等待同步(包括定时器通道)的位置;
- Mutex Profiling:互斥锁分析,报告互斥锁的竞争情况;
当程序存在内存 或者 CPU飙升的情况时,可以通过 pprof 工具来查询问题出现的根源。
pprof包含两个相关的库:
runtime/pprof
主要应用于工具型应用程序,包含脚本、定时任务等。
如:对于只跑一次的程序,例如每天只跑一次的离线预处理程序,调用 pprof 包提供的函数,手动开启性能数据采集。net/http/pprof
主要应用于服务型应用,包含 HTTP 服务,GRPC 服务等。
如:对于在线服务,对于一个 HTTP Server,访问 pprof 提供的 HTTP 接口,获得性能数据。当然,实际上这里底层也是调用的 runtime/pprof 提供的函数,封装成接口对外提供网络访问。
3.2 工具型应用程序性能分析
工具型应用主要使用runtime/pprof包实现性能分析。
 1
 2
 3
 4
 5
 6
 7
 8
 9
10
11
12
13
14
15
16
17
18
19
20
21
22
23
24
25
26
27
28
29
30
31
32
33
34
35
36
37
38
39
40
41
42
43
44
45
46
47
48
49
50
51
52
53
|
package main

import (
    "fmt"
    "os"
    "runtime/pprof"
)

func main() {
	// --- cpu 分析示例 start---
	// 创建cpu分析文件
	fc, err := os.Create("./cpu.prof")
	if err != nil {
		fmt.Println("create cpu.prof err:", err.Error())
		return
	}
	defer fc.Close()

	// 开始分析cpu
	err = pprof.StartCPUProfile(fc)
	if err == nil {
		defer pprof.StopCPUProfile()
	}
	// --- cpu 分析示例 end---

	var count int
	for i := 0; i < 10000; i++ {
		count++
	}
	fmt.Println("do finish......count:", count)

	// --- 内存 分析示例 start---
	fm, err := os.Create("./memory.prof")
	if err != nil {
		fmt.Println("create memory.prof err:", err.Error())
		return
	}
	defer fm.Close()

	// 开始分析内存
	err = pprof.WriteHeapProfile(fm)
	if err != nil {
		fmt.Println("write heap prof err:", err.Error())
		return
	}
	// --- 内存 分析示例 end---

    s := make([]int, 0)
	for i := 0; i < 10000; i++ {
		s = append(s, i)
	}
	fmt.Println("do finish...... s.len:", len(s))
}
|
执行 go run main.go 后,在代码目录下可以看到生成了 cpu.prof 和 memory.prof 文件。
通过执行 go tool pprof ./memory.prof 进入命令行模式 或者 go tool pprof -http=:8888 ./memory.prof 进入 web页面进行性能分析。
执行 go tool pprof ./memory.prof 进入命令行:
 1
 2
 3
 4
 5
 6
 7
 8
 9
10
11
|
192:SourceCodeTest mac$ go tool pprof memory.prof
Type: inuse_space
Time: Sep 11, 2022 at 2:42pm (CST)
Entering interactive mode (type "help" for commands, "o" for options)
(pprof) top
Showing nodes accounting for 1.16MB, 100% of 1.16MB total
      flat  flat%   sum%        cum   cum%
    1.16MB   100%   100%     1.16MB   100%  runtime/pprof.StartCPUProfile
         0     0%   100%     1.16MB   100%  main.main
         0     0%   100%     1.16MB   100%  runtime.main
(pprof)
|
3.3 网络服务型应用程序性能分析
使用 pprof 对网络应用程序进行性能分析,核心在于将 pprof的路由注册到服务中,并能提供访问。
1、使用默认ServerMux
ServerMux 是 net/http 包中的一个结构体,里面存储了指定路径和该路径对应的处理函数:
1
2
3
4
5
6
|
type ServeMux struct {
   mu    sync.RWMutex
   m     map[string]muxEntry
   es    []muxEntry // slice of entries sorted from longest to shortest.
   hosts bool       // whether any patterns contain hostnames
}
|
net/http 包中 Server 的 hander 默认就是 http.DefaultServeMux:
1
2
3
4
|
type Server struct {
   Addr    string  // TCP address to listen on, ":http" if empty
   Handler Handler // handler to invoke, http.DefaultServeMux if nil
}
|
在 ListenAndServe 函数中创建 Server 对象,然后调用其 ListenAndServe 方法:
1
2
3
4
5
|
// ListenAndServe always returns a non-nil error.
func ListenAndServe(addr string, handler Handler) error {
   server := &Server{Addr: addr, Handler: handler}
   return server.ListenAndServe()
}
|
server.ListenAndServe() 最终会调用到 ServeHTTP 方法,根据路径找到对应的执行函数,整个流程结束:
 1
 2
 3
 4
 5
 6
 7
 8
 9
10
|
func (sh serverHandler) ServeHTTP(rw ResponseWriter, req *Request) {
   handler := sh.srv.Handler
   if handler == nil {
      handler = DefaultServeMux
   }
   if req.RequestURI == "*" && req.Method == "OPTIONS" {
      handler = globalOptionsHandler{}
   }
   handler.ServeHTTP(rw, req)
}
|
net/http/pprof包中,有init函数:
1
2
3
4
5
6
7
|
func init() {
   http.HandleFunc("/debug/pprof/", Index)
   http.HandleFunc("/debug/pprof/cmdline", Cmdline)
   http.HandleFunc("/debug/pprof/profile", Profile)
   http.HandleFunc("/debug/pprof/symbol", Symbol)
   http.HandleFunc("/debug/pprof/trace", Trace)
}
|
所以如果使用默认ServerMux,则不需要注册,只需导入 net/http/pprof 包,其 init 函数自动完成注册来获取到pprof。
使用了默认的 http.DefaultServeMux,通常是代码直接使用 http.ListenAndServe("0.0.0.0:8000", nil),第二个参数赋值为 nil 的情况,对于这种类型的服务只需要在代码中添加一行,匿名引用 net/http/pprof:
 1
 2
 3
 4
 5
 6
 7
 8
 9
10
11
12
13
14
15
16
17
18
19
20
21
22
23
24
25
26
27
28
29
|
package main

import (
   "fmt"
   "net/http"
   _ "net/http/pprof"
   "strings"
)

func sayhelloName(w http.ResponseWriter, r *http.Request) {
   r.ParseForm()       //解析参数,默认是不会解析的
   fmt.Println(r.Form) //这些信息是输出到服务器端的打印信息
   fmt.Println("path", r.URL.Path)
   fmt.Println("scheme", r.URL.Scheme)
   fmt.Println(r.Form["url_long"])
   for k, v := range r.Form {
      fmt.Println("key:", k)
      fmt.Println("val:", strings.Join(v, ""))
   }
   fmt.Fprintf(w, "Hello pprof!")
}

func main() {
   http.HandleFunc("/", sayhelloName)       //设置访问的路由
   err := http.ListenAndServe(":9090", nil) //设置监听的端口
   if err != nil {
      fmt.Printf("ListenAndServe: %s", err)
   }
}
|
启动程序运行,
在浏览器执行 http://localhost:9090/?url_long=111&url_long=222 可看到返回内容 “Hello pprof!”。
执行 http://localhost:9090/debug/pprof/ 可看到画像信息。
2、使用自定义的 ServerMux
http.ListenAndServe 函数可以传递 handler,如果 handler 不为 nil,则说明使用了自定义的 ServerMux(否则用的是默认 DefaultServeMux),这种情况下,需要增加如下注册后,才能获取到pprof:
1
2
3
4
5
|
r.HandleFunc("/debug/pprof/", pprof.Index)
r.HandleFunc("/debug/pprof/cmdline", pprof.Cmdline)
r.HandleFunc("/debug/pprof/profile", pprof.Profile)
r.HandleFunc("/debug/pprof/symbol", pprof.Symbol)
r.HandleFunc("/debug/pprof/trace", pprof.Trace)
|
操作完成后,执行 http://localhost:9090/debug/pprof/ 可看到画像信息。
3、开源web框架
开源web框架很多,gin比较常用,此处就讲述一下如何在gin框架中使用pprof,分为两步:
- 直接引入 Gin 项目组提供的 gin-contrib/pprof 包;
- 调用 pprof.Register(r);
 1
 2
 3
 4
 5
 6
 7
 8
 9
10
11
12
13
14
15
16
17
18
|
package main

import (
   "github.com/gin-contrib/pprof"
   "github.com/gin-gonic/gin"
   "net/http"
)

func Ping(c *gin.Context) {
   c.String(http.StatusOK, "ok")
}
func main() {
   r := gin.Default()
   pprof.Register(r)
   r.GET("/ping", Ping)
   // Listen and Server in 0.0.0.0:8080
   r.Run(":8082")
}
|
启动程序服务后,执行 http://localhost:8082/ping 可看到返回结果 “OK”
执行 http://localhost:8082/debug/pprof/ 可看到画像信息。
之所以调用pprof.Register(r)后pprof相关路由可访问,是因为Register替我们做了路径注册的事情:
 1
 2
 3
 4
 5
 6
 7
 8
 9
10
11
12
13
14
15
16
17
18
19
20
21
22
23
24
25
26
27
28
29
|
// Register the standard HandlerFuncs from the net/http/pprof package with
// the provided gin.Engine. prefixOptions is a optional. If not prefixOptions,
// the default path prefix is used, otherwise first prefixOptions will be path prefix.
func Register(r *gin.Engine, prefixOptions ...string) {
   RouteRegister(&(r.RouterGroup), prefixOptions...)
}

// RouteRegister the standard HandlerFuncs from the net/http/pprof package with
// the provided gin.GrouterGroup. prefixOptions is a optional. If not prefixOptions,
// the default path prefix is used, otherwise first prefixOptions will be path prefix.
func RouteRegister(rg *gin.RouterGroup, prefixOptions ...string) {
   prefix := getPrefix(prefixOptions...)

   prefixRouter := rg.Group(prefix)
   {
      prefixRouter.GET("/", pprofHandler(pprof.Index))
      prefixRouter.GET("/cmdline", pprofHandler(pprof.Cmdline))
      prefixRouter.GET("/profile", pprofHandler(pprof.Profile))
      prefixRouter.POST("/symbol", pprofHandler(pprof.Symbol))
      prefixRouter.GET("/symbol", pprofHandler(pprof.Symbol))
      prefixRouter.GET("/trace", pprofHandler(pprof.Trace))
      prefixRouter.GET("/allocs", pprofHandler(pprof.Handler("allocs").ServeHTTP))
      prefixRouter.GET("/block", pprofHandler(pprof.Handler("block").ServeHTTP))
      prefixRouter.GET("/goroutine", pprofHandler(pprof.Handler("goroutine").ServeHTTP))
      prefixRouter.GET("/heap", pprofHandler(pprof.Handler("heap").ServeHTTP))
      prefixRouter.GET("/mutex", pprofHandler(pprof.Handler("mutex").ServeHTTP))
      prefixRouter.GET("/threadcreate", pprofHandler(pprof.Handler("threadcreate").ServeHTTP))
   }
}
|
4、grpc 类服务
上面的几种服务型应用都能通过链接直接访问,如果是grpc这种类型的服务,如何使用pprof呢?
pprof做CPU分析原理是按照一定的频率采集程序CPU(包括寄存器)的使用情况,所以可以:
- 在gRPC服务启动时,异步启动一个监听其它端口的HTTP服务,通过这个HTTP服务间接获取gRPC服务的分析数据;
- 因为 HTTP 使用默认的ServerMux(服务复用器),所以只要匿名导入net/http/pprof包,这个HTTP的复用器默认就会注册pprof相关的路由
 1
 2
 3
 4
 5
 6
 7
 8
 9
10
11
12
13
14
15
16
17
18
19
20
21
22
23
24
25
26
27
28
29
30
31
32
33
34
35
36
37
38
39
40
41
42
43
44
|
package main

import (
   "context"
   "log"
   "net"
   "net/http"
   "google.golang.org/grpc"
   pb "grpcservice/helloworld"
   _ "net/http/pprof"
)

const (
   port = ":50051"
   portpprof = ":50052"
)

// server is used to implement helloworld.GreeterServer.
type server struct {
   pb.UnimplementedGreeterServer
}

// SayHello implements helloworld.GreeterServer
func (s *server) SayHello(ctx context.Context, in *pb.HelloRequest) (*pb.HelloReply, error) {
   log.Printf("Received: %v", in.GetName())
   return &pb.HelloReply{Message: "Hello " + in.GetName()}, nil
}

func main() {
   //pprof
   go func() {
      http.ListenAndServe(portpprof, nil)
   }()

   lis, err := net.Listen("tcp", port)
   if err != nil {
      log.Fatalf("failed to listen: %v", err)
   }
   s := grpc.NewServer()
   pb.RegisterGreeterServer(s, &server{})
   if err := s.Serve(lis); err != nil {
      log.Fatalf("failed to serve: %v", err)
   }
}
|
3.4 pprof 数据分析
前面介绍的在应用程序中使用 pprof 包生成了数据,这些数据可以存储到文件里、也可以展示在浏览器中。
但是直接访问这些性能分析数据,是分析不过来什么的。Go 在 1.11版本后在它自带的工具集 go tool 里内置了 pprof 工具来分析由 pprof 库生成的数据文件。
使用go tool pprof分析数据,主要有两种写法:
- 通过路径,如
go tool pprof http://localhost:8082/debug/pprof/profile (进入命令行交互模式)
- 通过下载的文件,如
go tool pprof cpuprofile (进入命令行交互模式)或者 go tool pprof -http=:9091 cpuprofile(进入web页面)
进入命令行交互模式后,可以使用 help 查看所有子命令,使用 help <cmd|option> 查看子命令使用方法:
1
2
3
4
5
6
7
8
9
|
(pprof) help
Commands:
	callgrind        Outputs a graph in callgrind format
	comments         Output all profile comments

(pprof) help top
Outputs top entries in text form
  Usage:
    top [n] [focus_regex]* [-ignore_regex]* [-cum] >f
|
具体选择哪种根据自己需要使用。
1、CPU Profiling
先来看profile,访问/debug/pprof/profile这个链接会自动进行 CPU profiling,持续 30s,并生成一个文件供下载,可以通过带参数?=seconds=60进行60秒的数据采集。
为了模拟请求,使用 ab 进行压测:ab -k -c 1 -t 180 -n 100000000 http://localhost:8082/limit/countreject
执行 go tool pprof http://localhost:8082/debug/pprof/profile 会输出 CPU 使用情况的性能报告,默认需要等30s才会显示交互,然后就可以通过 top 分析哪个方法占用CPU 最多了。
top 列出最耗时的地方:
 1
 2
 3
 4
 5
 6
 7
 8
 9
10
11
12
13
14
15
16
17
18
19
20
21
22
23
24
25
|
pprof) top 20
Showing nodes accounting for 30.06s, 99.01% of 30.36s total
Dropped 52 nodes (cum <= 0.15s)
Showing top 20 nodes out of 78
      flat  flat%   sum%        cum   cum%
     8.74s 28.79% 28.79%      8.76s 28.85%  syscall.syscall
     5.99s 19.73% 48.52%      5.99s 19.73%  runtime.pthread_cond_signal
     4.46s 14.69% 63.21%      4.46s 14.69%  runtime.pthread_cond_wait
     3.25s 10.70% 73.91%      3.25s 10.70%  runtime.kevent
     2.25s  7.41% 81.32%      5.50s 18.12%  runtime.netpoll
        2s  6.59% 87.91%         2s  6.59%  runtime.nanotime
     1.44s  4.74% 92.65%      1.44s  4.74%  runtime.usleep
     0.68s  2.24% 94.89%      0.68s  2.24%  runtime.pthread_cond_timedwait_relative_np
     0.55s  1.81% 96.71%      1.23s  4.05%  runtime.notetsleep
     0.50s  1.65% 98.35%      0.67s  2.21%  net/http.(*connReader).backgroundRead
     0.11s  0.36% 98.72%     11.24s 37.02%  runtime.findrunnable
     0.04s  0.13% 98.85%      4.52s 14.89%  runtime.stopm
     0.03s 0.099% 98.95%      0.23s  0.76%  runtime.runqgrab
     0.02s 0.066% 99.01%      5.48s 18.05%  internal/poll.(*FD).Write
         0     0% 99.01%      2.84s  9.35%  asap/aredis.(*RedisManager).Do
         0     0% 99.01%      2.84s  9.35%  asap/aredis.(*RedisManager).Incr
         0     0% 99.01%      2.84s  9.35%  asap/aredis.(*RedisManager).Incr.func1
         0     0% 99.01%      2.84s  9.35%  asap/aredis.(*RedisManager).redialDo
         0     0% 99.01%      3.10s 10.21%  asap/controller/limit.CountReject
         0     0% 99.01%      1.50s  4.94%  bufio.(*Reader).ReadLine
|
每一行表示一个函数的信息:
- flat:函数在 CPU 上运行的时间
- flat%:函数在CPU上运行时间的百分比
- sum%:是从上到当前行所有函数累加使用 CPU 的比例,如第二行sum=48.52=28.79+19.73
- cum:这个函数以及子函数运行所占用的时间,应该大于等于flat
- cum%:这个函数以及子函数运行所占用的比例,应该大于等于flat%
- 最后一列:函数的名字
如果应用程序有性能问题,上面这些信息应该能告诉我们时间都花费在哪些函数的执行上。通过这些信息可以发现,redis操作所消耗的时间微乎其微。
生成函数调用图
在交互模式下输入 web,就能自动生成一个 svg 文件,并跳转到浏览器打开,生成了一个函数调用图,不过需要安装graphviz后才能使用。
打开的浏览器页面左上角方框内数据:表示显示的为cpu的画像。显示的节点在总的抽样时间X中,所占时长 及 比例为。
图中每个方框对应应用程序运行的一个函数,方框越大代表函数执行的时间越久(函数执行时间会包含它调用的子函数的执行时间,但并不是正比的关系);方框之间的箭头代表着调用关系,箭头上的数字代表被调用函数的执行时间。
方框中显示的时间为总执行时间 及 总时间占比。通过函数调用图,可以很直观的看出哪个函数耗时严重。
当确定出哪个函数耗时之后,可以用 pprof 子命令:list func_name 分析函数中的哪一行导致的耗时, 该命令将显示该函数语句 及 耗时的位置主要所在行。
2、Memory Profiling
内存分配既可以发生在堆上也可以在栈上。堆上分配的内存需要垃圾回收或者手动回收(对于没有垃圾回收的语言,例如 C++),栈上的内存则通常在函数退出后自动释放。Go 语言通过逃逸分析会将尽可能多的对象分配到栈上,以使程序可以运行地更快。
Tips: 两种内存分析策略:一种是当前的(这一次采集)内存或对象的分配,称为 inuse;另一种是从程序运行到现在所有的内存分配,不管是否已经被 gc 过了,称为 alloc。
memory profiling主要查看程序当前活动对象内存分配。使用方法和CPU Profiling相似,
执行: go tool pprof http://localhost:8082/debug/pprof/heap
top 命令列出最耗内存的地方
仍然使用top命令,可以看出最耗内存的位置,例如:
 1
 2
 3
 4
 5
 6
 7
 8
 9
10
11
12
13
14
15
|
(pprof) top 20
Showing nodes accounting for 16250.09kB, 100% of 16250.09kB total
      flat  flat%   sum%        cum   cum%
14704.35kB 90.49% 90.49% 14704.35kB 90.49%  golang.org/x/net/webdav.(*memFile).Write
 1024.38kB  6.30% 96.79%  1024.38kB  6.30%  runtime.malg
  521.37kB  3.21%   100%   521.37kB  3.21%  golang.org/x/net/webdav/internal/xml.init
         0     0%   100%  2154.28kB 13.26%  github.com/swaggo/gin-swagger/swaggerFiles.init.12
         0     0%   100%  1574.07kB  9.69%  github.com/swaggo/gin-swagger/swaggerFiles.init.5
         0     0%   100%    10976kB 67.54%  github.com/swaggo/gin-swagger/swaggerFiles.init.6
         0     0%   100% 15225.72kB 93.70%  runtime.doInit
         0     0%   100% 15225.72kB 93.70%  runtime.main
         0     0%   100%  1024.38kB  6.30%  runtime.mstart
         0     0%   100%  1024.38kB  6.30%  runtime.newproc.func1
         0     0%   100%  1024.38kB  6.30%  runtime.newproc1
         0     0%   100%  1024.38kB  6.30%  runtime.systemstack
|
每一列的含义和CPU Profiling中表达的一致,只不过这里显示的是内存。
给 go tool pprof 命令加上 -sample_index 参数后,可以切换内存分析的类型:
1
2
3
|
go tool pprof -sample_index=alloc_space http://localhost:8080/debug/pprof/heap
或者
go tool pprof -alloc_space http://localhost:8080/debug/pprof/heap
|
四种标签:
| 标签类型 |
标签功能 |
| inuse_space |
|
| inuse_objects |
|
| alloc_space |
|
| alloc_objects |
|
生成函数调用图
使用 web 命名,能够生成函数调用图,与 cpu 相似,只不过显示的内容为内存维度。
两个时间段的堆内存对比
业务可能存在这种场景:有的接口调用比较频繁,因此从一个时间点看确实内存上涨很多,但是它不一定是有问题的,这些申请的小内存在接口调用完成之后就会被释放。
这个时候可以将连续两个时间点的内存打印出来,再使用 go tool pprof --base old.heap new.heap 进行两个内存使用情况的对比。
3、Goroutine Profiling
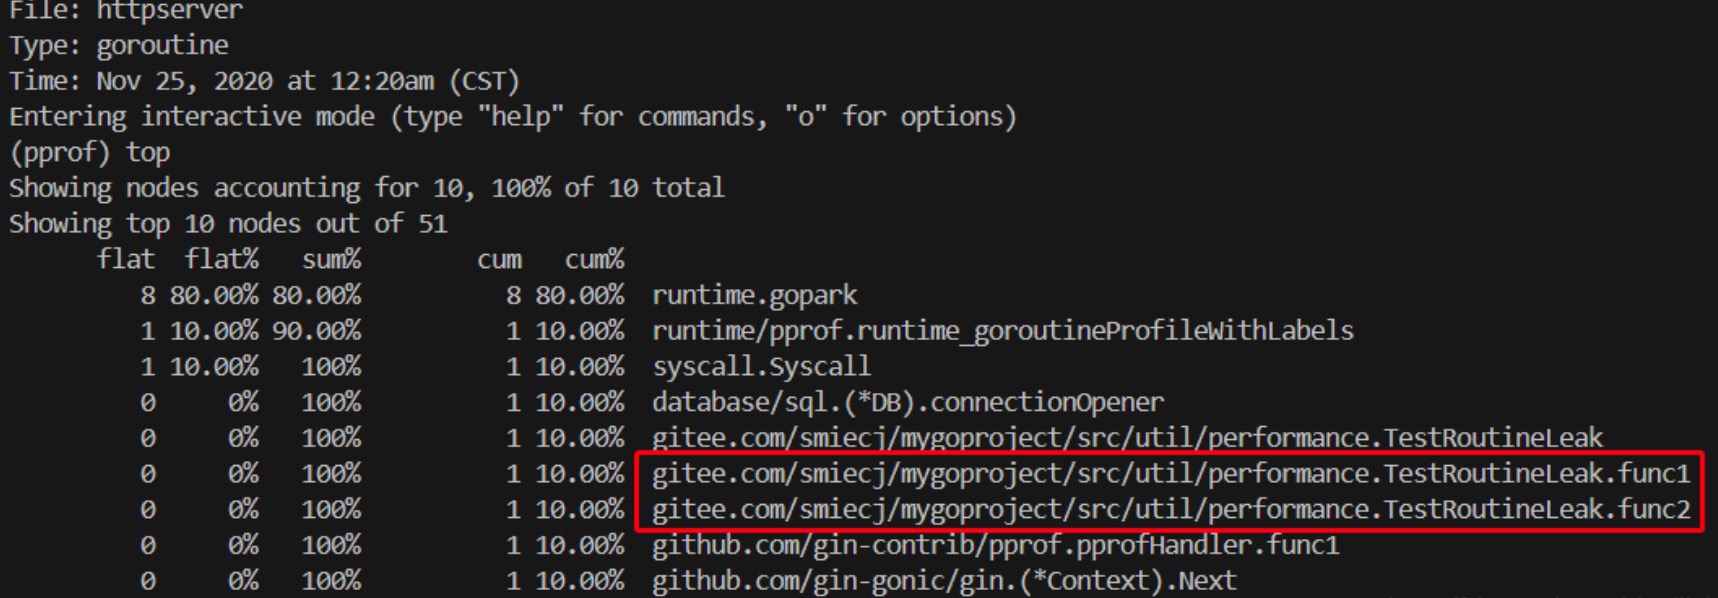
查看当前进程的 goroutine 数:go tool pprof http://localhost:6060/debug/pprof/goroutine
其中,runtime.gopark 表示是一个负责调度执行中的协程的任务。
分析routine 泄漏的问题,正常情况下routine 在执行完成之后肯定资源能被释放的。那么routine 泄漏的场景当然是本来应该结束,但是实际并没有结束的情况,于是可以写出下面的代码:
 1
 2
 3
 4
 5
 6
 7
 8
 9
10
11
12
13
14
15
16
17
18
19
20
21
22
23
|
func TestRoutineLeak() {
	channel := make(chan int, 1)

	go func() {
		index := <-channel
		log.Printf("[TestRoutineLeak] routine 1: %d", index)
	}()

	go func() {
		index := <-channel
		log.Printf("[TestRoutineLeak] routine 2: %d", index)
	}()

	go func() {
		index := <-channel
		log.Printf("[TestRoutineLeak] routine 3: %d", index)
	}()

	channel <- 1

	time.Sleep(10 * time.Second)
	//close(channel)
}
|
Channel 最后如果被关闭掉了,当然没什么问题。但是如果没close,其中两个协程就会一直等待结束。
这样就可以看到有两个协程一直没有被释放:
4、数据分析总结
使用profile可以获取很多重要信息,cpu profiling、memory profiling使用也是最频繁的。分析的时候,需要先获取到数据,通过web发现耗时的函数,然后通过list找到具体位置。
其它的数据的分析和CPU、Memory基本一致。下面列一下所有的数据类型:
- http://localhost:8082/debug/pprof/ :获取概况信息,即图一的信息
- go tool pprof http://localhost:8082/debug/pprof/allocs : 分析内存分配
- go tool pprof http://localhost:8082/debug/pprof/block : 分析堆栈跟踪导致阻塞的同步原语
- go tool pprof http://localhost:8082/debug/pprof/cmdline : 分析命令行调用的程序,web下调用报错
- go tool pprof http://localhost:8082/debug/pprof/goroutine : 分析当前 goroutine 的堆栈信息
- go tool pprof http://localhost:8082/debug/pprof/heap : 分析当前活动对象内存分配
- go tool pprof http://localhost:8082/debug/pprof/mutex : 分析堆栈跟踪竞争状态互斥锁的持有者
- go tool pprof http://localhost:8082/debug/pprof/profile : 分析一定持续时间内CPU的使用情况
- go tool pprof http://localhost:8082/debug/pprof/threadcreate : 分析堆栈跟踪系统新线程的创建
- go tool pprof http://localhost:8082/debug/pprof/trace : 分析追踪当前程序的执行状况
pprof对程序的性能优化还是很有利的,获取数据后,可以快速定位到耗时较多的位置进行优化,而且也支持只打印和某个函数相关的命令,很人性化。
四、线上程序性能分析
4.1 线上程序性能分析简介
线上环境和测试环境不同之处在于我们可能没有给程序单独开一个端口,可以直接访问 pprof 相关数据,这种情况下可能只能借助系统工具来单独分析了。
4.2 perf top 分析CPU 情况
1、直接打印内部方法使用CPU 占比
使用 perf top -p pid 命令直接打印内部方法使用CPU 占比。
该栏目可以看到占用CPU topN 高的函数(注意:其中CPU 的占比是开始执行perf 到现在的整体情况,因此需要运行一段时间之后才能看的出来)。
2、先导出CPU 使用情况文件,再进行分析
命令:
1
2
|
perf record -g -p 25573 – sleep 120
perf report --no-children
|
4.3 内存分析
对于内存来说,其实线上程序是比较难操作的,只能通过 top、pmap 等OS 命令查看进程的总内存大小,但是也不好分析具体是哪块内存占用多。还是需要打开 pprof 之后才能更好地分析。
五、GC分析
5.1 GC分析参数说明
| 参数 |
含义 |
默认值 |
| GOMAXPROCS |
go 的runtime 结构 GPM 中的M,表示同时间内最多有多少个processor 在运行。注意是用户态线程,和go 通过系统调用触发创建的线程数没有关系。 |
没有限制。默认和机器的CPU保持一致,但是如果是IO 密集型程序,可以再调高一些。 |
| GOGC |
GC 触发比例,新申请的内存大小 / 上一次GC 之后剩余的空间大小 |
100,调试的时候可设置为OFF |
| NextGC |
GC 出发条件,堆大小超过 NextGC 之后就会开始GC |
依赖GOGC 和上次GC 情况,计算后结果 |
| GODEBUG |
开启debug 的意思,下面还有很多参数可以调试 |
一些工具:gcvis-gotrace |
| GODEBUG-gctrace |
打印每次GC 的详细信息 |
|
| GODEBUG-schedtrace |
GC周期设置 |
单位:毫秒 |
| GODEBUG-scheddetail |
GPM模型的详细状态 |
|
| GODEBUG-tracebackancestors |
设置tracebackancestors = N,将会在触发堆栈信息打印的时候,打印N个“祖先”routine的数量 |
|
| GODEBUG-asyncpreemptoff |
设置 = 1,将会禁止基于信号造成的goroutine 抢占。一般用于定位GC 的问题 |
|
5.2 GC分析
示例:
 1
 2
 3
 4
 5
 6
 7
 8
 9
10
11
12
|
package main

import "fmt"

func main () {
    s := make([]int, 0)
    for i:= 0; i < 10000000; i++ {
        s = append(s, i)
    }

    fmt.Println(len(s))
}
|
指令:
 1
 2
 3
 4
 5
 6
 7
 8
 9
10
11
12
13
14
|
192:SourceCodeTest mac$ GOMAXPROCS=8 GOGC=100 GODEBUG='gctrace=1' ./split1 &
gc 1 @0.001s 2%: 0.010+0.51+0.004 ms clock, 0.062+0/0.53/0.029+0.026 ms cpu, 4->4->0 MB, 4 MB goal, 0 MB stacks, 0 MB globals, 8 P
gc 2 @0.002s 5%: 0.005+1.0+0.002 ms clock, 0.035+0/1.0/0.025+0.017 ms cpu, 5->5->1 MB, 5 MB goal, 0 MB stacks, 0 MB globals, 8 P
gc 3 @0.004s 5%: 0.006+3.5+0.014 ms clock, 0.039+0/1.5/0.039+0.084 ms cpu, 6->9->6 MB, 6 MB goal, 0 MB stacks, 0 MB globals, 8 P
gc 4 @0.010s 6%: 0.050+2.8+0.002 ms clock, 0.30+0/2.8/0.009+0.016 ms cpu, 15->15->5 MB, 15 MB goal, 0 MB stacks, 0 MB globals, 8 P
gc 5 @0.013s 21%: 0.023+1.4+4.3 ms clock, 0.14+0/1.2/0.007+25 ms cpu, 11->19->14 MB, 11 MB goal, 0 MB stacks, 0 MB globals, 8 P
gc 6 @0.020s 18%: 0.024+6.9+0.010 ms clock, 0.14+0/6.9/0.018+0.061 ms cpu, 37->37->12 MB, 37 MB goal, 0 MB stacks, 0 MB globals, 8 P
gc 7 @0.028s 17%: 0.021+2.1+0.003 ms clock, 0.12+0/2.1/0.058+0.019 ms cpu, 28->28->15 MB, 28 MB goal, 0 MB stacks, 0 MB globals, 8 P
gc 8 @0.030s 17%: 0.023+2.4+0.003 ms clock, 0.14+0/2.4/0.047+0.019 ms cpu, 35->35->19 MB, 35 MB goal, 0 MB stacks, 0 MB globals, 8 P
gc 9 @0.033s 15%: 0.023+12+0.005 ms clock, 0.14+0/12/0.012+0.035 ms cpu, 44->44->24 MB, 44 MB goal, 0 MB stacks, 0 MB globals, 8 P
gc 10 @0.046s 14%: 0.023+3.7+0.003 ms clock, 0.13+0/0.25/3.6+0.019 ms cpu, 55->55->30 MB, 55 MB goal, 0 MB stacks, 0 MB globals, 8 P
gc 11 @0.050s 14%: 0.023+7.8+0.008 ms clock, 0.13+0/7.8/0.020+0.051 ms cpu, 69->69->38 MB, 69 MB goal, 0 MB stacks, 0 MB globals, 8 P
gc 12 @0.059s 9%: 0.023+25+0.014 ms clock, 0.13+0/0.12/25+0.085 ms cpu, 86->86->86 MB, 86 MB goal, 0 MB stacks, 0 MB globals, 8 P
gc 13 @0.119s 8%: 0.038+49+0.015 ms clock, 0.23+0/49/0.033+0.091 ms cpu, 222->222->135 MB, 222 MB goal, 0 MB stacks, 0 MB globals, 8 P
|
可以看到一开始数组扩容比较频繁,所以GC 也是比较频繁的。后续内存扩到有几个G 之后,GC 就明显放缓了,设置会触发到2分钟一次的强制GC
设置GC 的频率
GOMAXPROCS=8 GOGC=100 GODEBUG=‘schedtrace=1000’ nohup ./可执行文件 > test.log 2>&1 &
这里会打印一些GC 的信息,前面表格中有说过了,但是比较简单,如果想要分析GC 的详细信息需要加上 tracebackancestors 参数。
https://zhuanlan.zhihu.com/p/473276871